As a middle school science teacher, I’ve seen first-hand how important it is to teach students data analysis skills and their practical applications. These skills aren’t just something we throw at students because the curriculum says so – they’re a survival tool for navigating the data-driven world we live in. Student performance in various subjects improves significantly when they can analyze real data effectively. Whether they pursue a career in data science or not, analytical skills are crucial for any job.
Have you ever noticed that your students can sometimes memorize definitions or concepts but can’t apply them? You’re not alone. In science classes, we have the perfect playground to help students develop problem-solving skills and strong data skills. With the right resources (which I hope to provide you with in this blog!), you’ll be able to help your middle school students become little data analysts. They’ll hopefully be able to read graphs, interpret charts, and make connections, and see data from different perspectives, all without any groaning!
Why should our middle schoolers care about data analysis skills? In short: data-driven decision-making is everywhere. It’s in science, business, politics, daily events, sports, etc. The ability to analyze real data effectively gives young adults a serious competitive edge as well as contributes to student achievement.
From making data-driven decisions at work in their future careers to decoding whether their favorite YouTuber’s stats are legitimate, data analysis skills help students think more critically about the world around them. I love when I can help students move beyond surface-level conclusions and dive more deeply into the “why” and “how” of the information in front of them. These skills can also boost student success in standardized tests, where many struggle with graph interpretation.
Lucky for us science teachers, teaching data analysis skills can be easily incorporated into our instructional practices. Whether you’re analyzing data from an experiment or having students interpret data collected by scientists, science class provides a fantastic opportunity for meaningful learning experiences.
Maybe you’re thinking, “This sounds great, but how do I teach this without putting everyone in the room to sleep? Fear not! I have some very handy resources and creative instructional strategies up my sleeve for you that will have your students analyzing data like pros in no time! You’ll be amazed at how well they apply these skills in grade-level projects and beyond.
First, let me show you some free tools that will help your students become more data-savvy without blowing your classroom budget. These tools will engage students with real data from different sources, fostering critical problem-solving skills along the way.
One of my favorite resources is Turner’s Graph of the Week. Every week, you can print a “Graph of the Week” pdf that contains a couple interesting graphs, data sets, or other visual representations as well as questions for students to answer and room for more general reflection-style writing. For example, one week students analyze graphs representing “The Costliest Hurricanes to Insurers” and “Global Reported Natural Disasters by Type, 1970 to 2024.” Another week, students ponder graphs titled “Smartphone Brands Retain Home Turf Advantage” and “Global Apple iPhone Shipment and Market Share.”

Conveniently, Turner’s Graph of the Week aligns with both the NGSS Science Standards and Common Core Math Standards, so you’re checking off lots of boxes for your lesson plans! The site also encourages students to make sense of problems, reason abstractly, and construct viable arguments.
You may want to implement Turner’s Graph of the Week as a warm-up, homework assignment, or group activity. The graphs are designed to engage students in analyzing real-world data, so you can be assured that using these graphs in your class will give students a taste of what data scientists and analysts do on a daily basis.
If you want your students to be exposed to more real-world problems, What’s Going On in This Graph from The New York Times is another awesome and free resource. The website posts various graphs, charts, and maps and invites students to discuss them in a live online conversation if you choose to use it. Or, there are general questions you can use in your classroom for whole-class style discussion or individual reflection.
For example, one fun post is titled “Summer Olympics Medal Count” and asks students to wonder, “Should a bronze medal count the same as a gold when determining who won the Olympics?”

This resource is deeply interactive and covers topics that students actually care about, like environmental changes, economic shifts, and social science. It’s a great place to start if you wish to invite your students to have meaningful conversations surrounding data.
Two of my favorite websites for virtual simulations and labs are Gizmos and PhET Interactive Simulations.
Gizmos takes learning to the next level with interactive simulations students can manipulate virtually. They can input and manipulate real data and see graphs and other visualizations form right before their eyes. It is a paid website, but there are some free options if you can’t afford a full subscription.

It’s interactive, encourages students to think “what if,” and taps into students’ developing technology skills. Plus, the simulations are all aligned with standards, so you know you are getting quality content.
Founded by a Nobel Laureate, PhET Interactive Simulations are designed based on extensive research about how to encourage inquiry-based learning. PhETs make the invisible visible whether you’re teaching chemistry, earth science, biology, physics, or math. Your students will be able to visualize data from different sources and interact with it in ways that feel more like gaming than learning.
In my opinion, PhETs are one of the best resources out there for helping visual learners understand science concepts.

I have created many resources specifically for teaching data analysis in your science classes. These resources are designed to enhance student learning while being easy to implement any day of the week.
If you’re looking for a simple, no-prep way to incorporate data analysis into your routine, look no further than my Data Analysis Bell Ringers. These are perfect for both middle and high school students. Each week, students can have the opportunity to practice analyzing data from different perspectives and drawing conclusions from graphs. The included slides contain relevant topics that will be sure to spark discussion amongst your students.
While I think this activity would be best used as a warmup (bell ringer) or closure activity, it could also be perfect as an extension activity for early finishers or individual slides on a Choice Board. Sometimes repetitive, consistent practice is just the thing your classes need for building data analysis skills.
In my experience, students love stations because they get to move around, work independently as well as with others based on the instructions at each station, and experience a range of activities to keep them intrigued and on task.
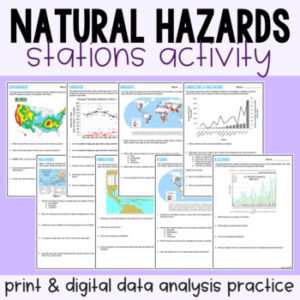
I have a number of awesome stations resources in my shop, one of which is the Natural Hazards Data Analysis Stations. These are great to get students to perform statistical analysis related to natural disasters like earthquakes, tsunamis, and hurricanes.
You’ll find that these particular stations are the perfect mix of academic rigor and engaging activities while allowing students practice with data visualization.
In our data-driven world, having the right skills to navigate through large datasets and make informed decisions is vital. By integrating opportunities for your students to analyze data into your science class, you are providing them with valuable insights that will stick with them long after the school year is over.
Whether students are working with graphs from data sources like the New York Times, manipulating variables in a simulated lab, or diving into natural hazard data, all of the resources above will be sure to boost student success and build confidence in data-driven decision-making.
So, don’t wait any longer, go get those kids analyzing some data!